|
Next: How Do I Get It?
Reporting
See where your time goes. We strive to make our reports clean, simple, and digestible, so they're useful.
Our TimeLines iPhone App includes TimeLines Basic Reporting. For professionals, TimeLines Pro Reporting is available with a TimeLines Pro subscription.
TimeLines Basic Reporting
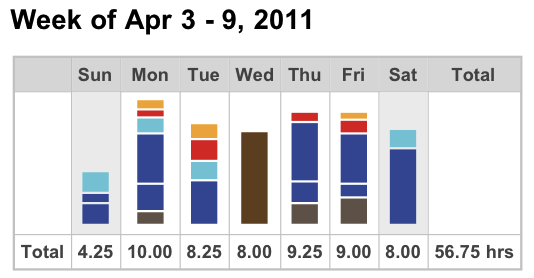
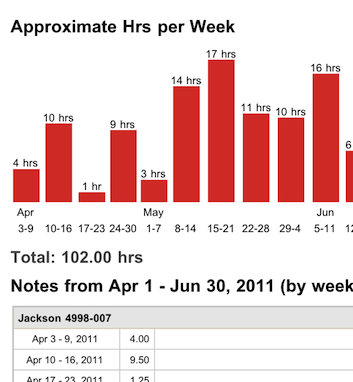
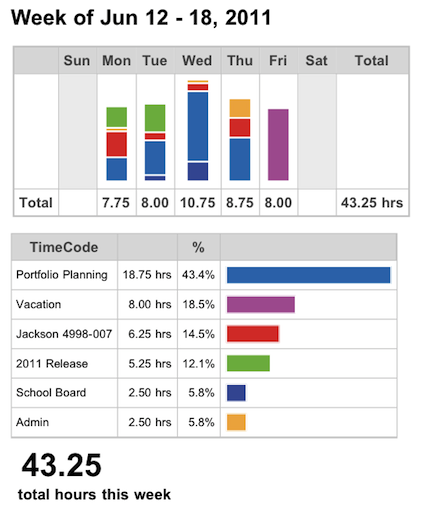
TimeLines includes two basic reports: a Summary Report for any time period, as a graph and pie chart, with all your notes, and Weekly Timesheet - your time as a familiar weekly timesheet with graphs to see your time for each day, and for each of your time codes. See totals and percentages at a glance.
See your time in the familiar timesheet grid; the bar graph puts your week into perspective.

Time grid and bar graph showing how your time was spent |
|
Color-coded bar graphs show you where your time went and highlight projects that are dominating your days. Spot items that simply don't get enough of your time.
Bar graph showing projects for each week
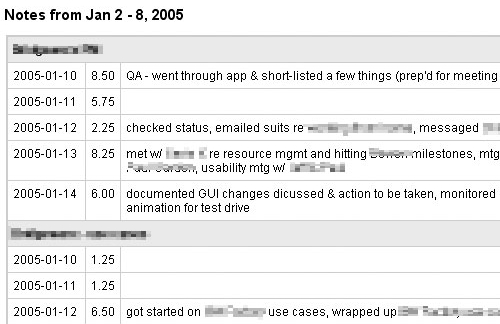
Your notes show you exactly what you did on a given day for a particular project. Produce detailed billing for your clients.
For professionals, TimeLines Pro Reporting is available with a TimeLines Pro subscription.
The Big Picture
The Wide Month Graph helps you see trends in your time, and ensure you captured it all.
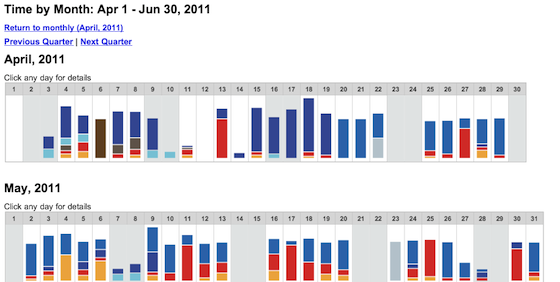
Daily Details
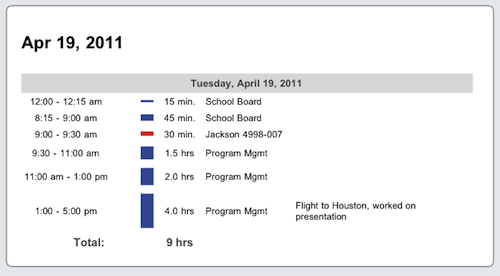
Tap any day on any graph to drill into its Daily Details. Examine your daily timeline for any day.
Cruise freely between the big picture and the details to explore your time data and discover patterns.
Client and Project Reporting
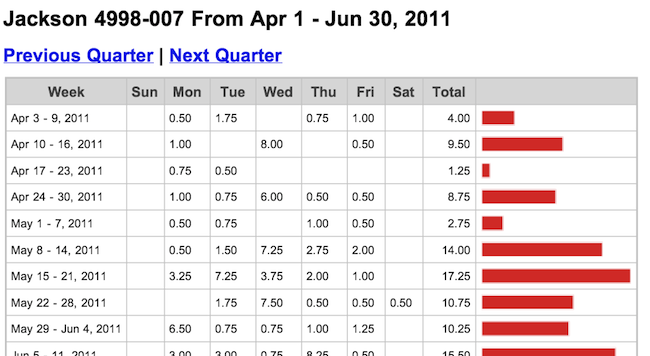
If you need to report your time to a client, generate invoices, or track your time for project reporting purposes, tapping any TimeCode on the Summary Report gives you a breakdown by week for the time you've spent on that code in the Weekly TimeCode Summary Report.
See all the time you spent on one time code over any time period, including all your notes grouped by week.
Tap from there into the Weekly TimeCode Detail Report to see your activity on every day of each week. Get the numbers and visualize at the same time.
Time Analysis
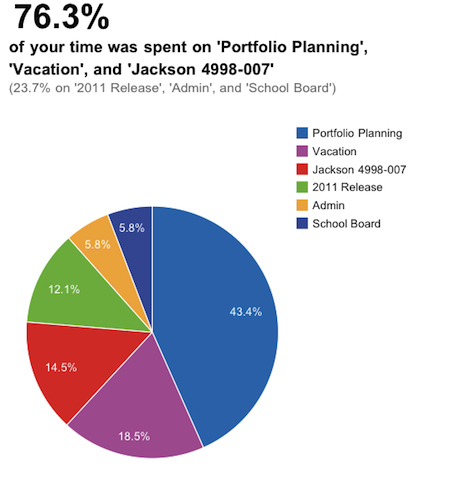
Analysis Reports show you various views of your time, using your color-coding. See how your spent your time each day, and compare to other time codes.
We want to help you see where your time goes so you can spend more of it the way you want to spend it.
How much is it worth to know where all your time really goes? Would it change the way you set priorities, or what you choose to spend your valuable time on?
Print, Save, Bookmark, Email, or Export any Report
All reports are pure standalone HTML, which means you can save them, print them, and email them exactly as-is.
A toolbar at the top and bottom of every report gives you a number of handy functions, no more than a click away.
Toolbar at the top & bottom of every report
Every report is rendered in pure HTML for maximum flexibility.
 |
 |
Pure HTML means that your report will print anywhere, from any browser |
|
 |
|
Save a snapshot of your timesheet at any point in time |
|
 |
|
Bookmark any report and recall it at any time with refreshed data |
|
 |
|
Email reports to anyone using our simple form |
|
 |
|
Export the data from any report to analyze or manipulate with other software, or just to save a copy of the raw data |
Prev: The Interface
Next: How do I get it? 
|